6 Mins Read
How to Measure the Business Value of Skills Intelligence


Summarise This Page with AI



Key Takeaways
- Skills intelligence ROI is provable, but not with learning metrics. The value sits in delivery economics: fulfilment speed, bench utilisation, premium hiring avoided, workforce productivity, and retention of critical capability.
- Five value pools cover almost every business case, and each has a formula a finance team can check.
- Attribution decides whether the number survives review. Baseline before rollout, compare against a matched business unit, and attribute at the decision level rather than claiming credit for every improvement.
- Value arrives on a curve. Visibility and fulfilment gains land in the first two quarters; productivity and workforce transformation ROI compound over two years.
- Model the cost side honestly, including internal hours, and present the case on one page in the language of the P&L.
The Budget Review Where Skills Programmes Stall
A skills programme usually dies in a budget review rather than a project meeting. The CHRO presents adoption: profiles created, skills mapped, dashboards live, managers trained. The CFO listens, then asks what the organisation can now do that it could not do before, and what that capability is earning. The room goes quiet, because those metrics were never designed to answer a question about money.
Skills intelligence is an unusually measurable investment, which makes the silence avoidable. It changes who gets staffed on what, how fast roles get filled, how much capacity sits idle, and how often the organisation pays a premium for skills it already owns. Every one of those has a number attached to it. This guide sets out the five value pools where skills intelligence ROI accumulates, the formula for each, how to attribute results credibly, when the value lands, and how to present the case on a single page.
Why the Usual ROI Answers Fail
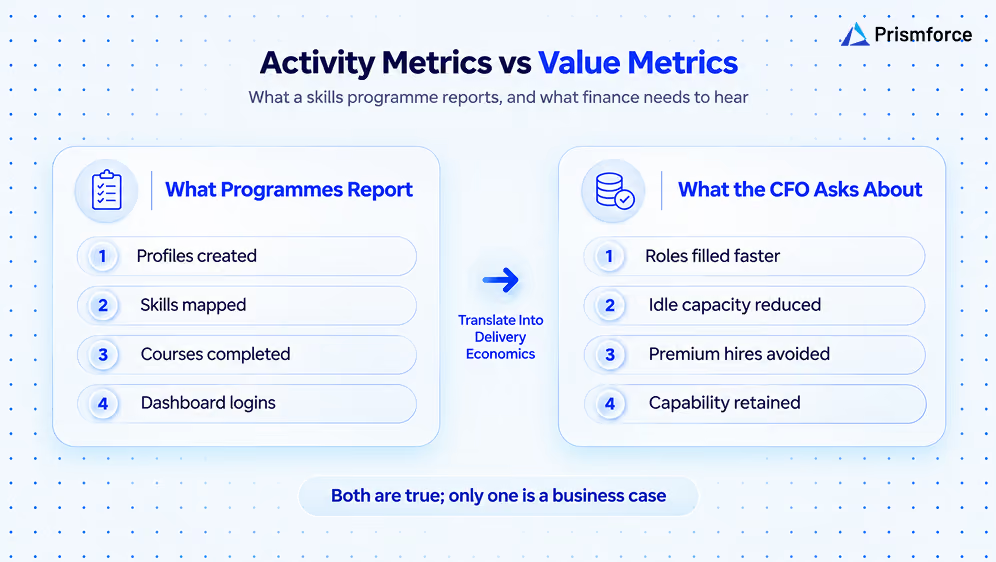
Three habits keep skills programmes from proving skills intelligence ROI. The first is measuring activity: profiles created, courses completed, dashboards viewed. Activity proves the platform is running, not that the business changed.
The second is claiming the whole improvement. A function that attributes every point of fulfilment improvement to its new platform invites finance to discount the entire case.
The third is measuring in the wrong function. Skills management ROI reported only through an L&D lens describes learning outcomes, while the money moves in staffing, delivery, and hiring. The pressure to get this right is rising: a Gartner survey found 48 percent of HR leaders agree the demand for new skills is evolving faster than existing talent structures and processes can support, which is precisely the gap a skills-based organisation is meant to close.
The Five Value Pools of Skills Intelligence
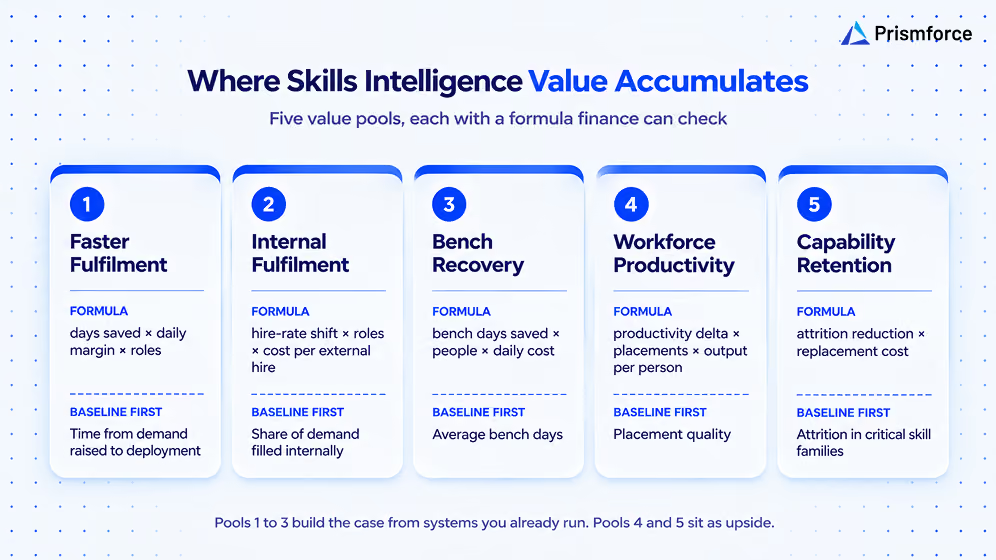
Each pool below states the mechanism, the formula, and the metric to baseline before anything changes.
1. Faster Fulfilment
Validated skill data lets staffing find qualified people immediately instead of searching manually across teams, so roles fill sooner and revenue starts earlier.
Formula: days of fulfilment time saved per role × daily revenue or margin per deployed person × roles filled per year.
Baseline first: current average time from demand raised to person deployed, split by role family. Enterprises running SkillPrism report 30 percent lower time-to-fill, which turns directly into earlier revenue recognition on billable roles and is usually the first line of a skills intelligence platform ROI case.
2. Higher Internal Fulfilment and Lower External Hiring
When the organisation can see its own capability, it stops buying skills it already has. This is the largest and most defensible of the skills intelligence benefits, because the avoided cost is a real invoice.
Formula: (baseline external hire rate minus current external hire rate) × roles filled × fully loaded cost per external hire, including agency fees, onboarding, and ramp time.
Baseline first: share of demand filled internally. SkillPrism deployments report a 25 percent improvement in internal fulfilment, and the value per avoided external hire runs far above the recruiting fee once ramp time is counted.
3. Bench and Utilisation Recovery
Idle capacity usually reflects a visibility problem rather than a demand problem. People sit unstaffed because nobody knows what they can do, and the adjacencies that would make them deployable stay invisible.
Formula: reduction in average bench days × number of people affected × daily cost of an unbilled resource.
This pool is where a services or delivery organisation typically finds its largest single skills management ROI number, and it is also the easiest to verify, since bench reports already exist.
4. Workforce Productivity
Placing people in work that matches their capability raises output, and the effect is measurable. Gartner's research on skills-based placement found that employees moved into roles based on promise rather than full proficiency are 1.9 times more likely to perform effectively, which is an argument for better matching data rather than stricter gatekeeping.
Formula: workforce productivity delta on matched placements × number of placements × revenue or output per person.
Workforce productivity gains are harder to isolate than cost savings, so hold this pool to a conservative estimate and let the operational metrics carry the skills intelligence ROI case.
5. Retention of Critical Capability
Losing a specialist costs the replacement, the ramp, and often a delivery commitment, and visible career paths reduce that loss.
Formula: reduction in regretted attrition among critical-skill groups × fully loaded replacement cost.
Baseline first: attrition rate in the skill families the business cannot afford to lose, not the organisation-wide average. Retained capability is among the least visible skills intelligence benefits and often the most expensive to lose.
A Worked Example
Consider a modelled delivery organisation of 10,000 people filling 1,200 roles a year, with 18 percent of demand met externally and an average bench of 6 percent.
Moving internal fulfilment from 82 to 87 percent avoids roughly 60 external hires. Cutting time-to-fill by 10 days across 1,200 roles releases 12,000 days of earlier deployment. Reducing bench by one percentage point returns roughly 100 people-months to billable work. None of those three figures needs a productivity assumption, and together they usually exceed platform cost several times over before retention enters the calculation.
The numbers above are illustrative, and the point is the structure: build the skills intelligence platform ROI case from the two or three pools you can evidence from systems you already run, then treat workforce productivity and retention as upside rather than as the foundation. A skills-based organisation earns its case on capacity it can prove, not on capability it hopes for.
Attribution That Survives a CFO Review
A business case fails on attribution more often than on arithmetic. Four practices keep the numbers defensible.
- Baseline before you deploy. Capture fulfilment rate, time-to-fill, bench percentage, and critical-skill attrition for at least two quarters before go-live, because a baseline reconstructed afterwards is an estimate and finance treats it as one.
- Use a comparison group. Roll out to some business units before others and compare movement between them. A matched unit running the old process is the closest thing to a control group a talent function will ever get.
- Attribute at the decision level. Count the roles where the platform surfaced the person who was actually deployed, rather than claiming every improvement in the period. Under-claiming with evidence beats over-claiming with narrative.
- Discount for other causes. Hiring freezes, demand shifts, and market conditions all move the same metrics. Name them in the case before someone else does.
When the Value Lands
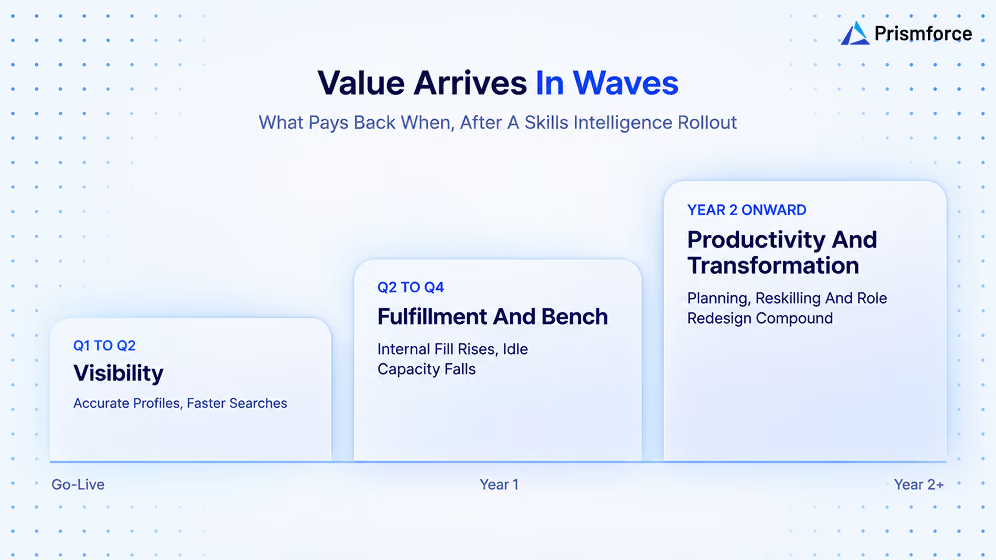
Value arrives in three waves, and promising it all in quarter one is how programmes lose credibility.
Quarters one and two: visibility. Profiles become accurate and searchable, and staffing searches that used to take days resolve in minutes. SkillPrism reports a 2 to 5x increase in skill visibility for enterprise deployments, which is the precondition for every skills intelligence benefit that follows.
Quarters two to four: fulfilment and bench. Internal fill rates rise and bench days fall as adjacency data surfaces people who were always deployable and never visible. The bulk of first-year skills management ROI comes from here.
Year two onward: productivity and transformation. Workforce planning, targeted reskilling, and role redesign start to compound, which is where workforce transformation ROI shows up in margin rather than in cost avoidance, and where the skills-based organisation stops being a programme and becomes an operating model.
Model the Cost Side Honestly
An ROI case with a soft cost side gets discounted entirely. Five lines cover it: platform fees, integration with HRIS, ATS, LMS and project systems, validation effort from managers and subject matter experts in the early quarters, change management, and internal programme hours. Internal hours are the line teams omit and finance asks about.
Presenting cost honestly also protects the case later, because a workforce transformation ROI of 4x on a fully loaded cost base is far harder to challenge than a claim of 12x on licence fees alone.
The One-Page Business Case
Executives approve what they can read in a minute. Six blocks fit on a page: the decisions the business cannot make well today, the value pools chosen with their formulas, the baseline for each metric, the fully loaded cost, the realisation timeline, and the attribution method. Keep the modelled upside conservative and the baseline evidence strong, and the skills intelligence ROI number will do its own arguing.
The Bottom Line
Skills intelligence ROI is not a softer number than any other enterprise technology case; it is simply measured in the wrong place. Move the measurement out of learning and into delivery, pick the two or three value pools your systems can already evidence, baseline them before rollout, attribute at the decision level, and let workforce productivity and retention sit as upside. Built that way, the case holds in the budget review where skills programmes usually stall.
See how SkillPrism turns validated skill data into fulfilment, bench, and productivity outcomes. Book a demo
Frequently Asked Questions
How do you measure skills intelligence ROI?
Measure skills intelligence ROI in delivery economics rather than learning activity. Quantify five value pools: faster fulfilment, higher internal fill rate, bench and utilisation recovery, workforce productivity, and retention of critical capability. Baseline each metric before rollout and attribute results at the decision level.
What are the main skills intelligence benefits for an enterprise?
The core skills intelligence benefits are validated capability data, faster staffing of open demand, fewer external hires for skills already in-house, lower idle capacity, better-matched placements, and career paths that retain specialists. Together they convert a skills-based organisation from aspiration into measurable operating performance.
Which metrics prove skills intelligence platform ROI?
Five metrics carry a skills intelligence platform ROI case: internal fulfilment rate, time from demand raised to deployment, bench days and utilisation, placement quality, and regretted attrition in critical skill families. Baseline each for two quarters before go-live so improvement is measured rather than estimated.
How long before skills intelligence ROI shows up?
Visibility gains appear in the first two quarters, fulfilment and bench improvements through quarters two to four, and productivity and workforce transformation ROI from year two as planning, reskilling, and role redesign compound. Promising the full return in quarter one costs the programme credibility.
How do you attribute results to the platform rather than other factors?
Baseline before deployment, roll out to some business units first and compare against matched units, count only the roles where the platform surfaced the person actually deployed, and name other causes such as hiring freezes or demand shifts in the case itself.
What costs belong in a skills management ROI calculation?
Platform fees, integration with HRIS, ATS, LMS and project systems, manager and subject-matter-expert validation effort in the early quarters, change management and enablement, and internal programme hours. Omitting internal hours is the most common reason finance discounts an otherwise sound case.
Is workforce productivity a reliable ROI measure for skills programmes?
Workforce productivity is real but harder to isolate than cost avoidance, so treat it as upside rather than foundation. Gartner found employees moved into roles on promise rather than full proficiency are 1.9 times more likely to perform effectively, which supports better matching data over stricter gatekeeping.
Get exclusive access to workforce and talent insights
Thank you! Your submission has been received!
Oops! Something went wrong while submitting the form.
Demo Prismforce products
Get in touch with our experts and sign up for a demo