6 Mins Read
How Skills Analytics Platforms Help Leaders Make Better Workforce Allocation Decisions


Summarise This Page with AI



Key Takeaways
- Analytics earn their place by changing an allocation decision. A skills analytics platform that produces dashboards without a decision owner produces reporting, not skills intelligence.
- Leaders make four allocation decisions: who works on this, where to build capability, where to place the work, and which commitments to renegotiate. Each needs different data at a different grain.
- Organisation-level averages hide the constraint. Allocation analysis has to run at skill, proficiency, team, and location grain to be usable.
- Confidence belongs on the screen. An answer built from three stale profiles and one built from three thousand validated ones should never look identical to a leader.
- Every reallocation has a second-order cost. Good analytics show what the move breaks elsewhere before the move is made.
The Dashboard That Answers a Question Nobody Asked
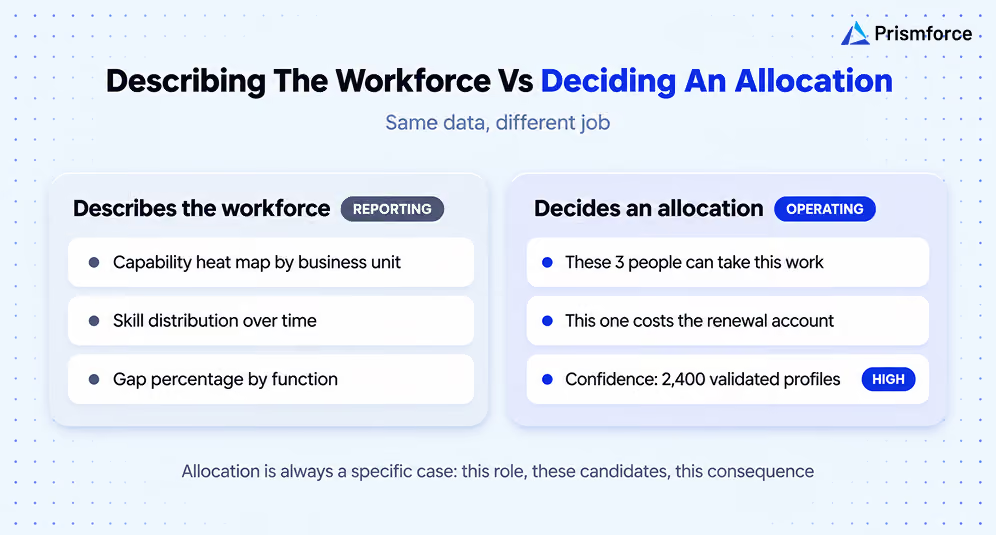
Workforce analytics programmes rarely fail for lack of data. They fail because the output describes the workforce while leaders are trying to decide something about it. A heat map showing capability distribution across twelve business units is interesting. It does not tell a delivery director whether to pull the senior data engineer off the renewal account to rescue the new implementation, which is the decision actually on the table.
The distance between those two things is where most analytics investment disappears. Closing it does not require more dashboards; it requires designing analysis around the handful of decisions leaders genuinely make about allocating people, then supplying each with data at the right grain, with the right confidence attached, and with the consequences of the move made visible. This article covers those four decisions, what each one needs, and how to tell whether the analytics are improving them.
Describing the Workforce Is Not Deciding About It
The gap between analytics availability and analytics usefulness is widening rather than closing. HR.com's State of People Analytics research found that only 45 percent of HR professionals believe their analytics systems improve talent and business decisions, down from 57 percent two years earlier, and only one in four connect workforce data to broader business metrics.
Adoption outside HR tells the same story. Insight222's research found that while most people analytics functions share dashboards with managers and executives, only 28 percent report high adoption outside HR, which is precisely where allocation decisions are made.
Both findings point at the same design flaw. Analytics built to describe a workforce answer questions in the general case, and allocation is always a specific case: this role, this week, these three candidates, this consequence. A skills insight platform earns its keep by answering the specific version, which is also what turns skills intelligence from a reporting asset into an operating one.
The Four Allocation Decisions Leaders Actually Make
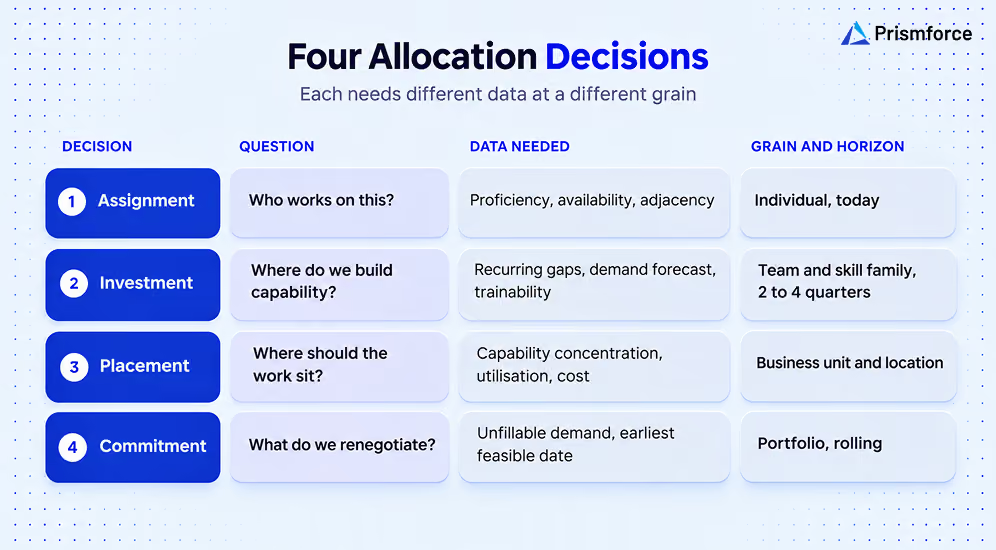
Allocation is not one decision. Separating it into four makes the analytics requirement obvious.
Assignment: who works on this? The immediate question. Needs validated proficiency, availability, adjacency for near-fit candidates, and location or time-zone constraints, at individual grain and current as of today.
Investment: where do we build capability? A quarterly question about where training and development money goes. Needs recurring gap patterns, demand forecasts by skill, and trainability signals, at team and skill-family grain across a two-to-four-quarter horizon.
Placement: where should the work sit? Which team, practice, or location takes a piece of work. Needs capability concentration by location, utilisation, and cost, at unit grain.
Commitment: what do we renegotiate? The decision leaders avoid until it is too late. When capability genuinely cannot be assembled in time, the honest options are rescoping, resequencing, or renegotiating the date. Needs an accurate read on what cannot be filled, early enough to act.
That fourth decision is the one a skills analytics platform improves most and gets credited for least. Knowing three weeks earlier that a commitment is unstaffable changes more outcomes than a marginally better shortlist ever will.
Grain Beats Breadth
The most common analytical failure in workforce data is aggregating until the constraint disappears. An organisation reporting near-complete coverage of a critical skill looks healthy, right up to the point where the analysis is cut by proficiency, location, and availability and reveals four people at the required level, two of them committed and one on notice.
Allocation analysis therefore needs four cuts as a minimum: skill, proficiency level, organisational unit, and location or time zone, with availability layered over all of them. The useful output is not a percentage but a list of names with evidence attached.
Reaching that grain requires coverage no survey-based approach can produce, which is why inference sits beneath every useful piece of skills intelligence.
An engineering firm of 25,000 people using SkillPrism achieved 4x better skill discoverability through automated profiling and a standardised taxonomy, and discoverability is the precondition for analysis at grain. AI skills intelligence software builds that base by reading project history, learning records, and code contributions continuously, rather than waiting for people to describe themselves.
Put Confidence on the Screen
Leaders over-trust analytics that hide their own uncertainty. Two answers can look identical on a dashboard while resting on entirely different evidence: one drawn from thousands of validated profiles refreshed this month, the other from a handful of self-assessments last touched two years ago.
A mature skills insight platform reports confidence alongside every answer, built from three inputs: how much of the relevant population has profile coverage, how recently the underlying evidence was refreshed, and how the skills were validated. AI skills intelligence software can compute all three automatically, which is what makes confidence reporting practical rather than aspirational. Presenting that alongside the result changes leader behaviour in exactly the right way, since a low-confidence answer prompts verification rather than action.
Confidence scoring also protects the programme. When an allocation recommendation turns out badly, a platform that flagged low confidence keeps its credibility, while one that presented a guess as a fact loses it permanently.
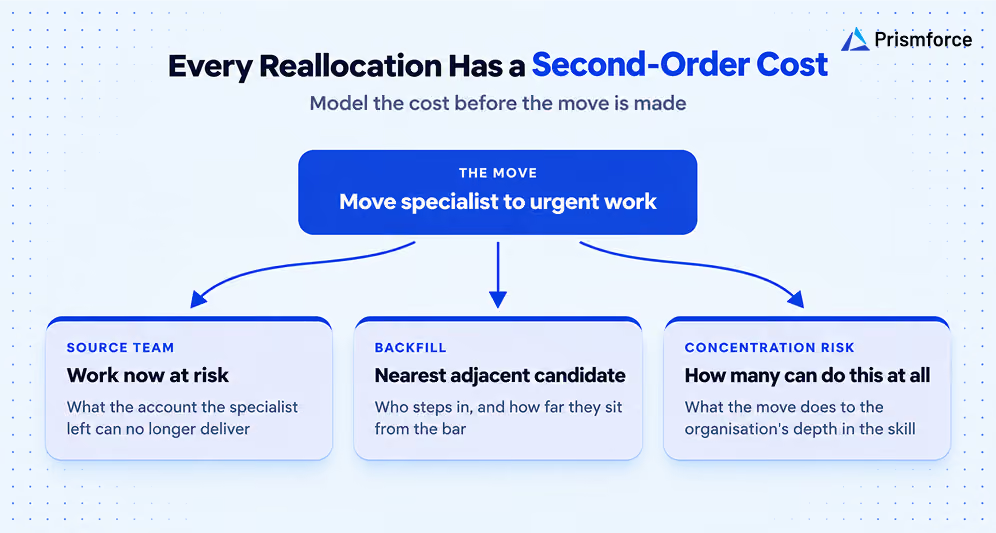
Every Reallocation Has a Second-Order Cost
Moving a scarce specialist to the urgent problem always solves the urgent problem. The cost appears elsewhere, usually two weeks later, in the account the specialist left.
Allocation analytics should make that cost visible before the decision rather than after. Three modelling questions cover most of it. What does the source team lose, expressed as the work now at risk? Who backfills, and how far is the nearest adjacent candidate from the bar? And what does the move do to the organisation's concentration risk, given how many people can do this at all?
A skills insight platform that answers these turns allocation from a sequence of local optimisations into a portfolio decision. Leaders stop asking who is free and start asking what this move costs, which is the more expensive question to answer and the more valuable one.
Allocation and AI-Enabled Work
A newer criterion has entered allocation decisions. Delivery leaders increasingly need to know not only who holds the technical skills for a piece of work, but who can deliver it in an AI-augmented way, which is a separate and separately measurable capability.
Treating AI readiness as an allocation input rather than a training topic changes staffing on AI-enabled programmes, because the deploy-ready population is usually much smaller than the technically qualified one. Feeding readiness into the same skills intelligence record keeps both views in one place rather than in competing spreadsheets, scored through the role-level AI readiness model behind AIQ
Measuring Whether Allocation Improved
Analytics programmes are usually measured on usage, which says nothing about decision quality. Four measures say more.
Decision latency, the time from a demand or escalation arriving to an allocation decision being made. A skills analytics platform should compress this visibly within a quarter.
Reversal rate, the share of allocations changed within 30 days, which exposes decisions made on thin or stale evidence.
Near-fit utilisation, the share of allocations filled by candidates surfaced through adjacency rather than exact match, which shows whether the analytics are widening the usable pool.
Forecast accuracy, how closely predicted gaps matched actual shortfalls a quarter later, which is the only honest test of predictive skills intelligence.
Tracked together, these tell a leadership team whether the skills analytics platform is improving decisions or simply describing them more attractively.
The Bottom Line
A skills analytics platform helps leaders allocate better when it is designed around the four decisions they actually make, delivers data at skill, proficiency, unit, and location grain rather than organisational averages, reports its own confidence, and models what a reallocation costs elsewhere. Measure it on decision latency, reversal rate, near-fit utilisation, and forecast accuracy rather than dashboard usage. Built this way, skills intelligence stops being a reporting layer and starts being the instrument leaders reach for when the resourcing call gets hard.
See how SkillPrism turns validated capability data into allocation decisions leaders can defend. Book a demo
Frequently Asked Questions
What is a skills analytics platform?
A skills analytics platform analyses validated workforce capability data to support decisions about allocating people: who works on what, where to build capability, where to place work, and which commitments to renegotiate. It differs from reporting tools by answering specific allocation questions rather than describing the workforce.
How does a skills analytics platform improve workforce allocation?
By supplying evidence at the grain allocation requires: individual proficiency, availability, adjacency, and location, with confidence attached to each answer. It also models second-order effects, showing what a reallocation costs the source team and the organisation's concentration risk before the move is made rather than after.
Why do workforce analytics dashboards fail to change decisions?
Because they answer general questions while allocation is always specific. Research shows analytics adoption outside HR remains low and fewer than half of HR professionals believe their systems improve business decisions, which usually reflects analysis designed to describe rather than to decide.
What data grain does allocation analysis need?
At minimum four cuts: skill, proficiency level, organisational unit, and location or time zone, with availability layered across all of them. Organisation-level averages conceal the constraint, so the useful output is a list of names with evidence rather than a coverage percentage.
Why should a skills insight platform report confidence?
Because two answers can look identical while resting on very different evidence. Reporting coverage, recency, and validation method alongside each result prompts leaders to verify low-confidence answers instead of acting on them, and it protects the platform's credibility when a recommendation goes wrong.
What does AI skills intelligence software add to allocation?
Continuous inference from work signals, which produces the coverage and currency that grain-level analysis depends on. AI skills intelligence software also supports newer allocation criteria such as AI readiness, since the population able to deliver AI-augmented work is usually smaller than the technically qualified one.
How do you measure whether allocation decisions improved?
Track decision latency from demand to allocation, reversal rate within 30 days, near-fit utilisation showing allocations filled through adjacency rather than exact match, and forecast accuracy comparing predicted gaps against actual shortfalls a quarter later. Dashboard usage measures none of this.
Get exclusive access to workforce and talent insights
Thank you! Your submission has been received!
Oops! Something went wrong while submitting the form.
Demo Prismforce products
Get in touch with our experts and sign up for a demo