10 Mins Read
The AI Workforce Readiness Framework: 10 Metrics Every Enterprise Should Track


Summarise This Page with AI



Key Takeaways
- An AI workforce readiness framework becomes operational when it produces trackable metrics. Ten measures across three tiers, baseline, movement, and business impact, cover the full loop.
- Usage is not capability. Adoption dashboards can look excellent while readiness sits flat, which is why every metric here scores capability against role-level baselines rather than logins.
- Baseline metrics establish where the workforce stands, movement metrics prove the program works, and impact metrics translate readiness into staffing capacity and revenue language.
- Each metric carries a trap. Averages hide distributions, completions impersonate closure, and org-wide scores erase the role context that makes a number actionable.
- Three metrics deserve board time: deploy-ready capacity, verified gap closure rate, and internal fill rate of AI demand, because each connects workforce readiness directly to delivery.
- In a workforce where people and AI agents share the work, roles shift as agents take on tasks. The metrics therefore run as a continuous loop that triggers interventions and re-baselines roles as the work changes.
Readiness Programs Fail on Reporting Before They Fail on Training
AI workforce readiness programs rarely die from bad learning content. They die in the quarterly review, when the numbers on the slide cannot answer what leadership asked. Usage climbed, licenses got used, and nobody in the room can say whether the workforce can deliver AI-transformed work, because a usage dashboard cannot see that difference at all.
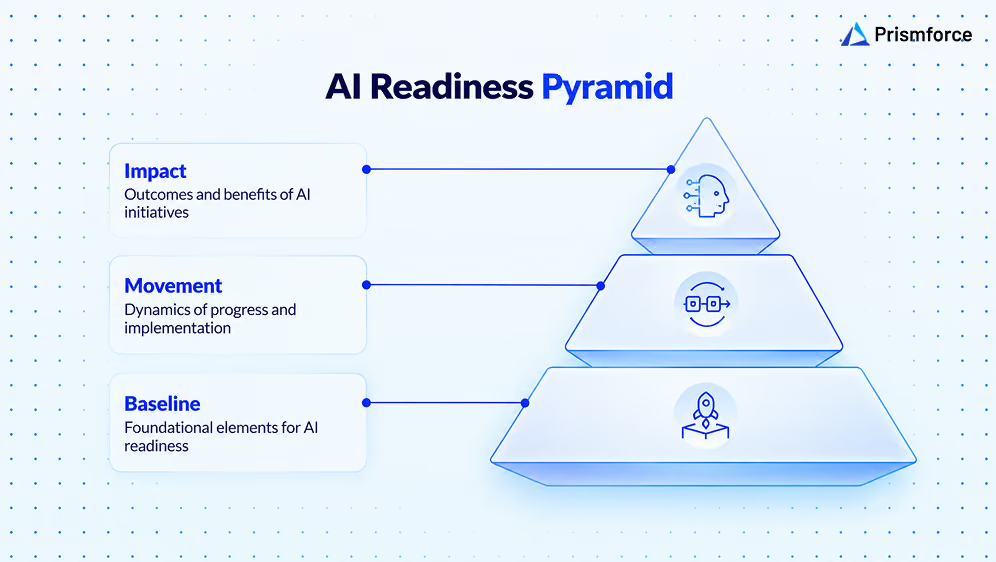
The fix is a metrics layer designed for capability rather than activity. This article lays out an AI workforce readiness framework as ten metrics in three tiers: four that establish the baseline, three that prove movement, and three that convert readiness into business impact. Each comes with the question it answers, how to compute it, and the trap that quietly breaks it. Because agents keep absorbing tasks inside roles, the stack is built to run continuously, so the numbers move as fast as the work does.
How the Framework Is Organized
The three tiers mirror the questions leadership asks in order. Baseline metrics answer where the workforce stands today. Movement metrics answer whether the AI workforce strategy is changing that position. Impact metrics answer what the change is buying, which is where workforce transformation stops being a program and starts being an operating capability.
The distinction between usage and capability is the whole reason the stack exists. The EY 2025 Work Reimagined Survey found 88 percent of employees now use AI at work while only 5 percent use it in ways that transform their work, a difference no adoption metric can surface.
One design rule holds across all ten: every score compares against a role-level baseline, not an organization-wide bar. An AI readiness assessment that measures a delivery manager and a solutions architect against the same standard produces numbers nobody can act on.
Tier 1: Baseline Metrics
1. Baseline Coverage
The question: how much of the workforce has a measured, role-benchmarked readiness score at all? Compute it as assessed employees divided by total in-scope workforce. Coverage below roughly 80 percent means every other metric describes a sample, not the organization. The trap is counting self-registrations as assessments, which inflates coverage with unmeasured profiles.
2. Average Readiness Score vs Role Baseline
The question: how far does measured capability sit from what roles require? Compute the gap between each person's score and their role's expected proficiency, then average by practice and organization. Reported alone this number misleads, which is why the next two metrics exist. The trap is tracking the raw score without the baseline, which rewards easy populations.
3. Proficiency Distribution by Band
The question: what share of each practice sits in each band, from novice through expert? An average of 60 can hide a barbell of experts and beginners with nobody deployable in the middle. As an illustration, an AIQ leadership view might show 11 percent of a practice at proficient or above while 63 percent need urgent upskilling, two facts one average would erase. The trap is reporting distribution only at organization level, where practice differences wash out.
4. Dimension Gap Index
The question: which capability dimension drives each team's gap? Average the per-dimension shortfall, across areas such as core AI competency, prompt fluency, data and automation, model patterns, deployment, and governance, per team. A practice strong on tool fluency and weak on governance needs a different intervention than its twin with the reverse profile. The trap is blending dimensions into one number, which is how governance weaknesses reach production unnoticed.
Tier 2: Movement Metrics
5. Readiness Velocity
The question: how fast are scores moving against baselines per quarter? Compute score change per assessed employee per quarter, segmented by practice and intervention type. Velocity is the earliest proof the program works, arriving quarters before business metrics can. The trap is measuring velocity only on the enthusiast cohort, which overstates what the program does for everyone else.
6. Verified Gap Closure Rate
The question: what share of targeted gaps closed, confirmed by re-assessment rather than completion? Compute re-verified closures divided by gaps targeted in the period. The EY survey found only 12 percent of employees receive sufficient AI training and estimates companies are missing up to 40 percent of AI productivity gains through talent-strategy weaknesses, and closure verification is precisely the discipline that separates training spend from capability built. The trap is the oldest one in L&D: counting completions as closures.
7. Time to Deploy-Ready
The question: how long does it take to move someone from baseline to their role's deployment bar? Compute the median days from first assessment to verified readiness, segmented by starting band. This metric prices every skilling decision, since it tells planners whether building capability beats buying it for a given demand. The trap is averaging across bands, which hides that far-from-target cohorts need a different strategy, not more of the same one.
Tier 3: Business Impact Metrics
8. Deploy-Ready Capacity
The question: what share of the workforce can be staffed on AI-enabled programs today? Compute employees at or above their role's readiness bar divided by in-scope workforce, cut by practice and location. This is the metric that moves readiness from an HR review into delivery planning, because it denominates capability in staffing language. The trap is a static bar: as role expectations rise, yesterday's deploy-ready threshold quietly stops predicting delivery success.
9. Internal Fill Rate of AI Demand
The question: what share of demand for AI-capable roles gets filled by upskilled or redeployed internal talent rather than external hiring? Compute internal fulfilments divided by total AI-role demand filled. A rising fill rate is the economic proof of the skilling portfolio, since building and moving talent costs a fraction of buying it. The trap is excluding redeployments, which undercounts the cheapest wins the skills adjacency data makes possible.
10. Readiness-Backed Revenue Coverage
The question: what share of AI-linked pipeline and programs is backed by teams that meet readiness bars? Compute AI-attributed revenue on ready-staffed programs divided by total AI-attributed revenue. Demonstrable workforce readiness increasingly supports skill-based pricing and outcome-driven engagements, and this metric shows how much of the revenue story the workforce can actually stand behind. The trap is claiming coverage from planned training rather than verified readiness, which converts a trust asset back into a slide.
Running the Metrics as a Continuous Loop
In a workforce where people and AI agents share the work, the definition of ready keeps moving. An agent takes over test generation or first-draft analysis, and within weeks the people around it need stronger review, orchestration, and governance skills than their baseline measured. A quarterly snapshot records that shift after it has already slowed delivery.
The stack therefore runs as a loop with four parts.
Continuous analysis. Skill inference reads project, code, and learning signals every week, so baseline and movement metrics stay current between formal assessments.
Triggered interventions. A drop in a team's dimension score or a stall in readiness velocity launches a targeted learning path, mentoring, or a redeployment conversation the same month. Waiting for the quarterly review turns a two-week fix into a quarter-long gap.
Triggered re-baselining. When agents absorb a task inside a role, that role's baseline is revised at that point, with an annual review as a backstop. The task-level analysis behind Prismforce's Roles of the Future research shows role expectations recomposing quickly enough that a static bar understates the readiness the business actually needs. Deploy-ready capacity is only as honest as the bar underneath it.
Fixed reporting rhythms. Baseline and movement metrics go to leadership quarterly, owned by the skills platform team and L&D. Impact metrics report monthly into the reviews where staffing, pricing, and delivery capacity get decided, owned by delivery and workforce planning.
Prismforce runs this loop in live AIQ programs, feeding readiness gaps straight into learning plans and staffing decisions, and those programs have delivered a 3 to 5 percent uplift in billable utilization. In one global IT services program, a single quarter of gap-targeted learning plans moved a visible share of the workforce out of the lowest AI trainability bands.
Where to Start When You Cannot Track All Ten
A first-quarter program does not need the full stack. Three metrics form the minimum viable set: baseline coverage, because nothing else means anything until the workforce is measured; proficiency distribution by band, because it is the first number that changes leadership conversations; and verified gap closure rate, because it establishes the discipline of re-assessment before habits form around completions.
Add movement metrics in quarter two once a re-assessment cycle exists, and bring impact metrics online when readiness data first meets a staffing decision. Sequencing this way keeps each new metric attached to a decision someone is already making, which is what protects the framework from becoming reporting for its own sake.
The Bottom Line
An AI workforce readiness framework earns its name when it runs on numbers: four baseline metrics that establish position, three movement metrics that prove the program works, and three impact metrics that convert an AI-ready workforce into staffing capacity and revenue coverage. Track all ten with role-level baselines underneath and the AI skills gap stops being a talking point and becomes a managed quantity.
See how AIQ puts all ten metrics on one leadership view. Book a demo
Frequently Asked Questions
What is an AI workforce readiness framework?
An AI workforce readiness framework is a structured model for defining, measuring, and improving a workforce's capability to deliver AI-augmented work. An operational framework produces trackable metrics across baseline position, quarterly movement, and business impact, all scored against role-level proficiency expectations.
What metrics measure AI workforce readiness?
Ten metrics cover the loop: baseline coverage, average score versus role baseline, proficiency distribution, and dimension gap index establish position; readiness velocity, verified gap closure rate, and time to deploy-ready prove movement; deploy-ready capacity, internal fill rate, and readiness-backed revenue coverage show impact.
Why are AI adoption metrics not enough?
Adoption metrics count usage, and usage does not equal capability. EY's 2025 survey found 88 percent of employees use AI while only 5 percent use it transformatively, a gap invisible to login dashboards but decisive for delivery, pricing, and workforce transformation outcomes.
What is deploy-ready capacity?
Deploy-ready capacity is the share of the workforce meeting or exceeding their role's readiness bar, cut by practice and location. It translates an AI readiness assessment into staffing language, telling delivery leaders how much AI-enabled work the organization can commit to today.
How do you verify an AI skills gap has closed?
Re-assess proficiency after the intervention against the same role-level baseline used at first measurement, and confirm the person now meets the bar on live work. Verified closures divided by gaps targeted gives the closure rate, which separates capability actually built from training merely delivered.
How often should AI readiness metrics be reported?
Baseline and movement metrics report quarterly, with continuous inference keeping profiles current between assessment cycles. Impact metrics report monthly into staffing and delivery reviews, and role baselines themselves get annual revision, because AI keeps raising the proficiency each role genuinely requires.
Who should own AI readiness metrics?
Ownership splits by tier. The skills platform team and L&D own baseline and movement metrics, while delivery and workforce planning own impact metrics, since deploy-ready capacity and internal fill rate belong in the reviews where staffing and pricing decisions actually get made.
Get exclusive access to workforce and talent insights
Thank you! Your submission has been received!
Oops! Something went wrong while submitting the form.
Demo Prismforce products
Get in touch with our experts and sign up for a demo